
Data View: see your knowledge graph without a whiteboard
 The Curiosity Team
Complex data models have a visibility problem. The schema exists — in code, in documentation, in someone's head — but getting a clear picture of what's actually in the graph, how types relate, and what's safe to change requires either deep familiarity or a lot of digging. For teams new to a Curiosity deployment, or working across a large and evolving data model, that friction is real.
The new Data view is built to remove it.
A map of your data model
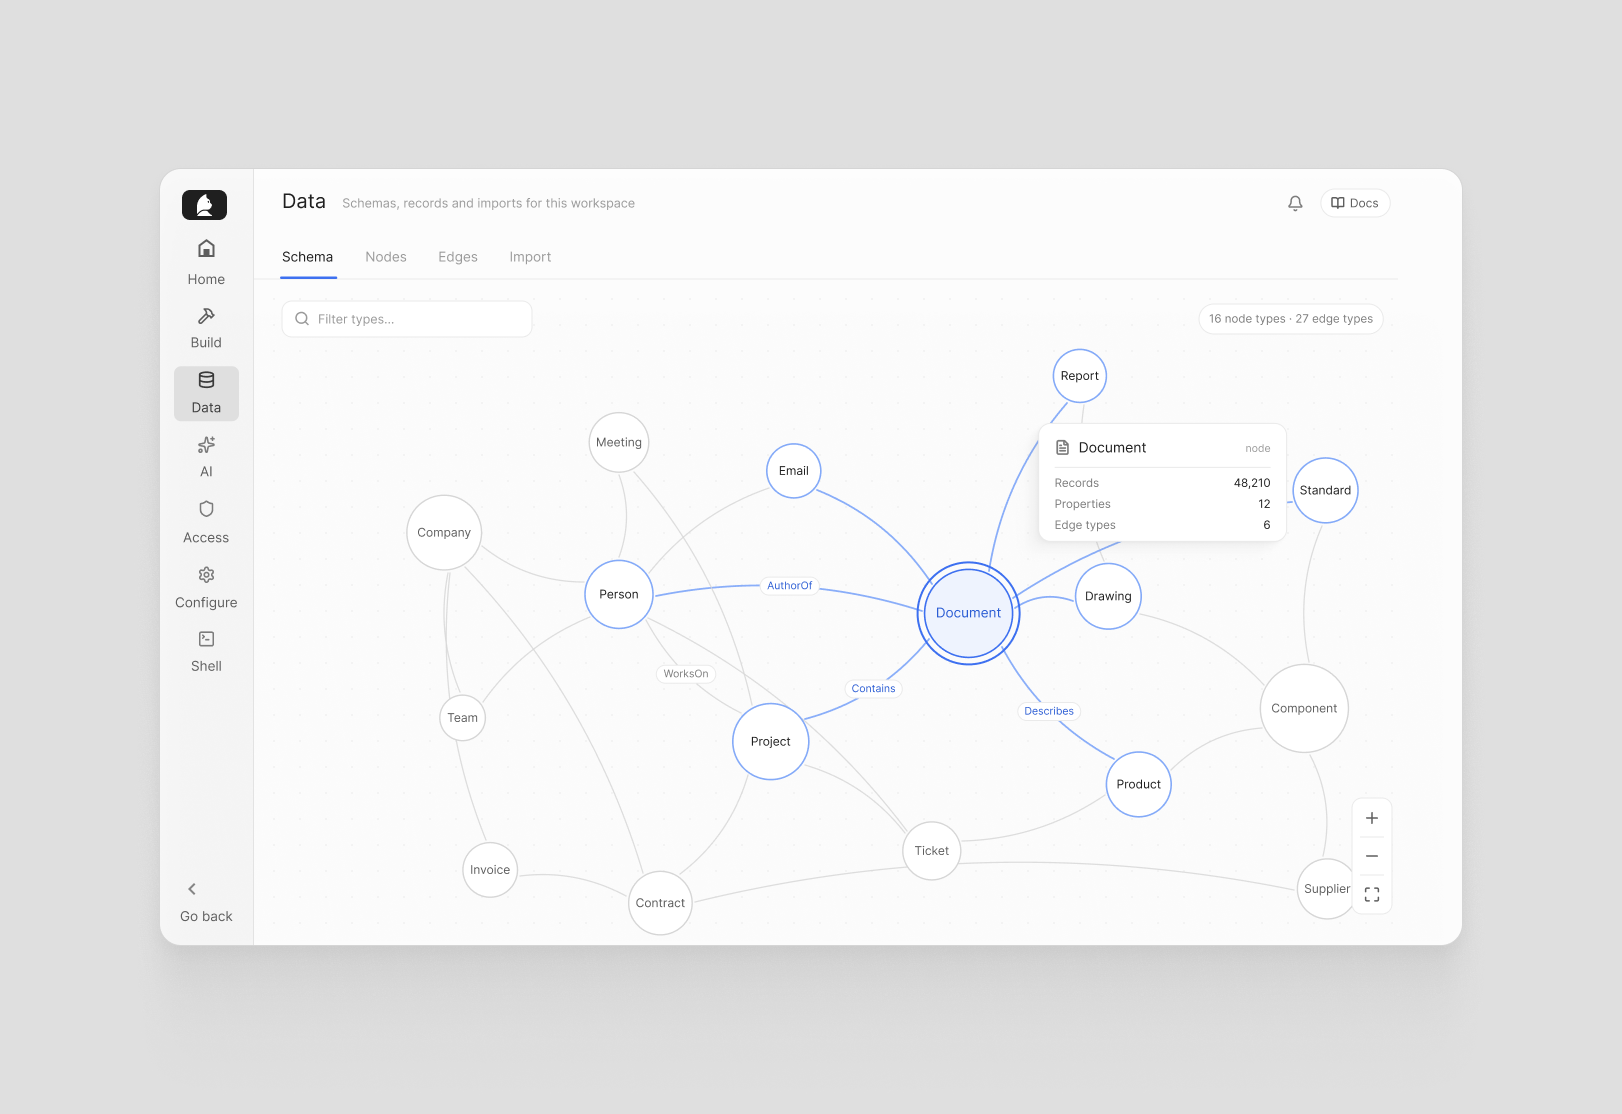
The Schema tab renders your entire knowledge graph as an interactive force graph — every node type, every edge type, and how they connect, visible at once. Zoom in on a cluster, follow a relationship chain, get a feel for the topology without reading a single line of code.
It's the kind of overview that used to live on a whiteboard or in a diagram someone made once and never updated. Here it's always current, always accurate, and always one click away.
Node and edge management
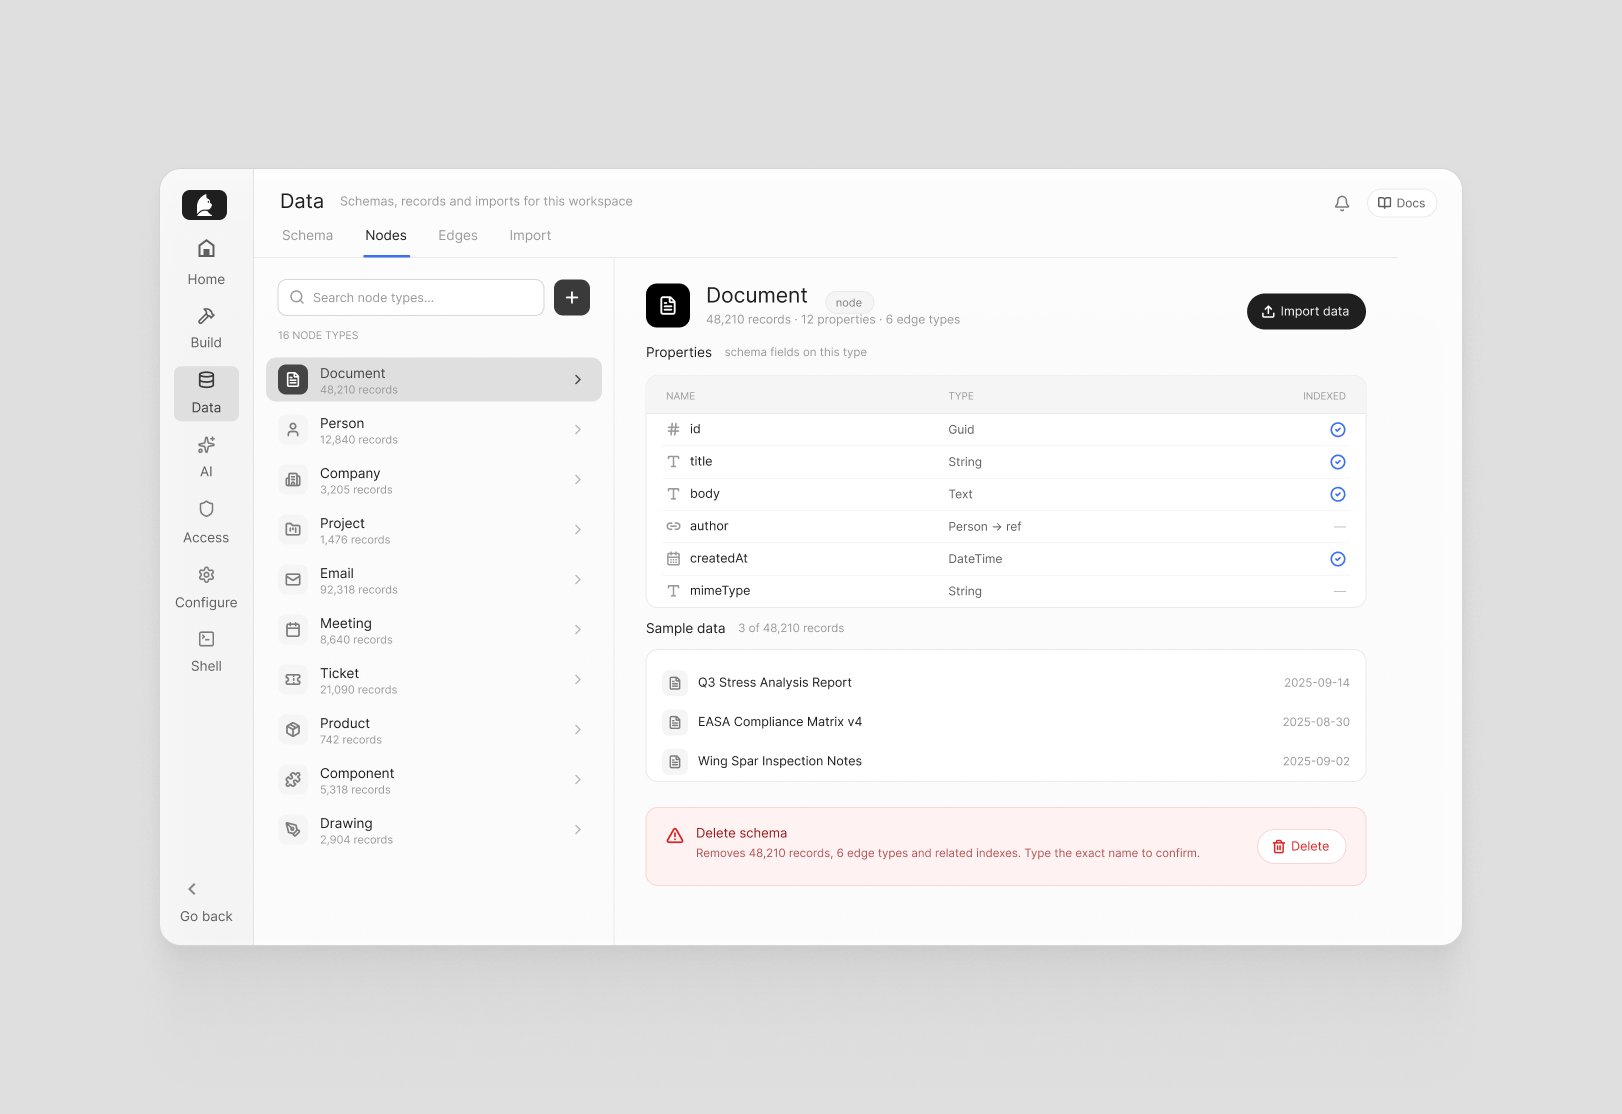
The Nodes and Edges tabs give you a searchable view of every type in your graph, with per-type detail on the right: properties, sample data, and shortcuts to import more. New node and edge schemas can be created directly from here.
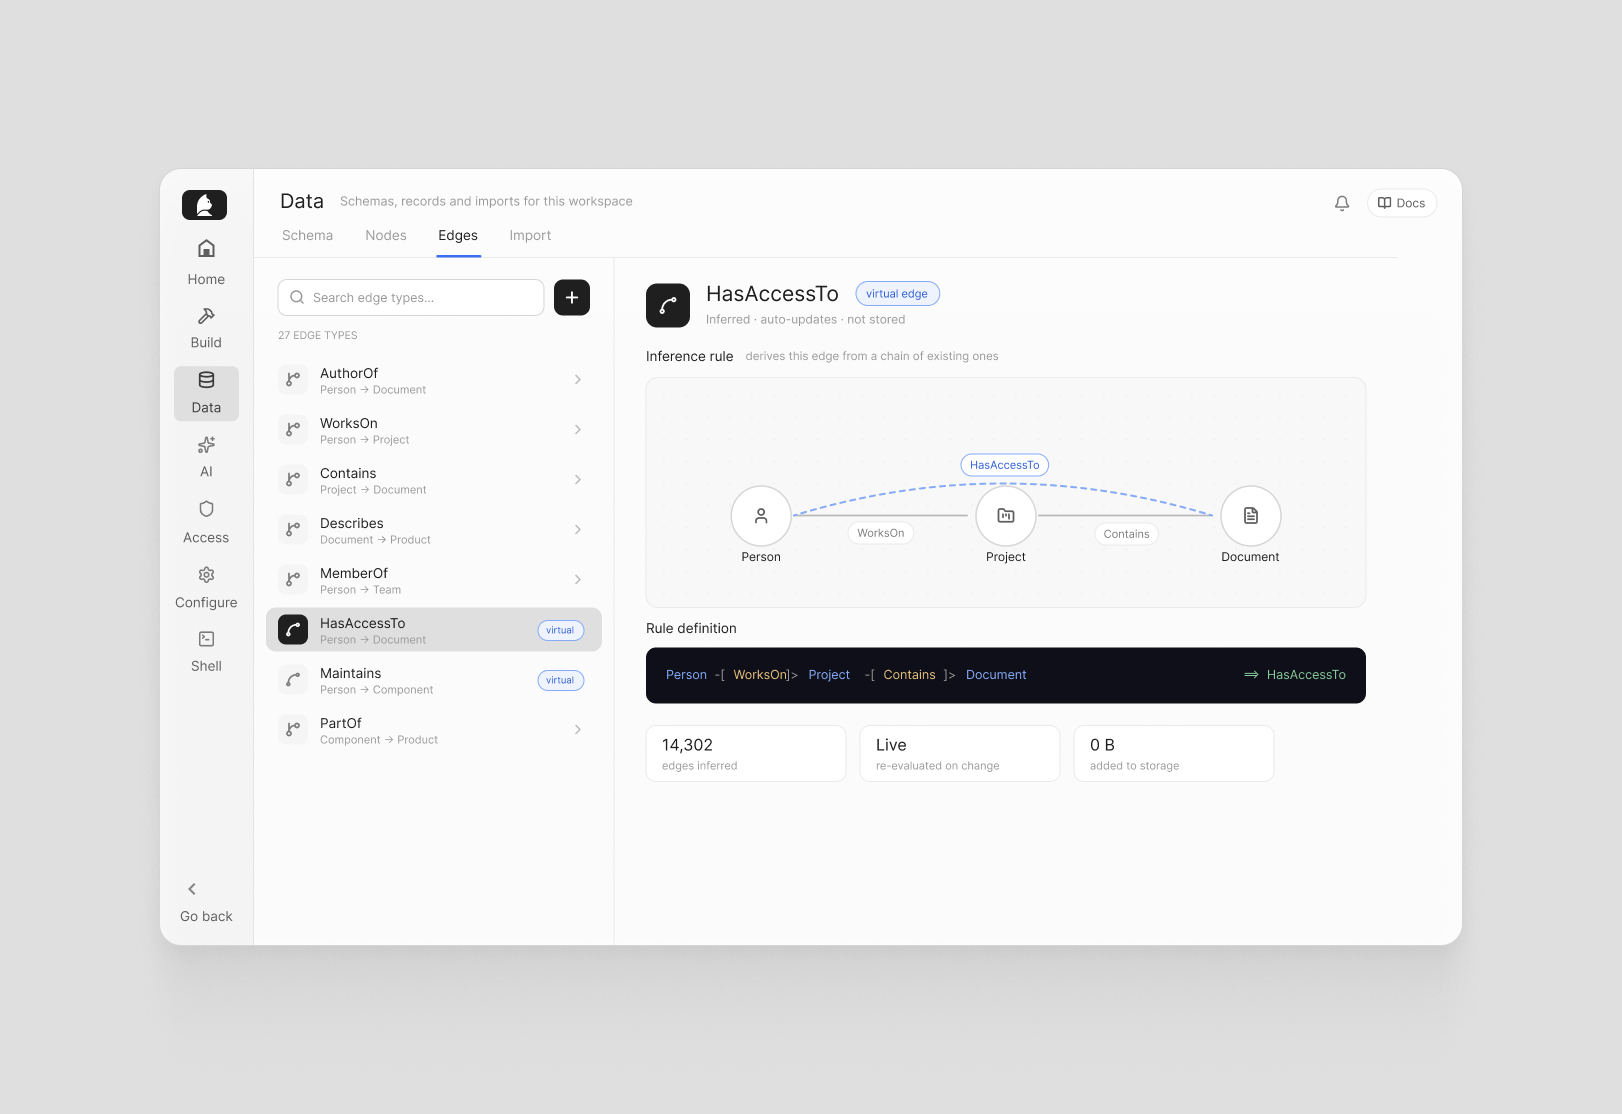
Edges include support for virtual edges — inferencing rules that automatically derive relationships from chains of existing ones. If A connects to B and B connects to C, you can define a rule that infers A connects to C, without re-importing or restructuring your data. It's a clean way to surface implicit relationships that are already there in the graph but not yet explicit.
Destructive operations — deleting a schema — require typing the exact name to confirm, and the interface explains what else would be affected: related indexes, connected edges, all associated data. No surprises.
Code export for builders
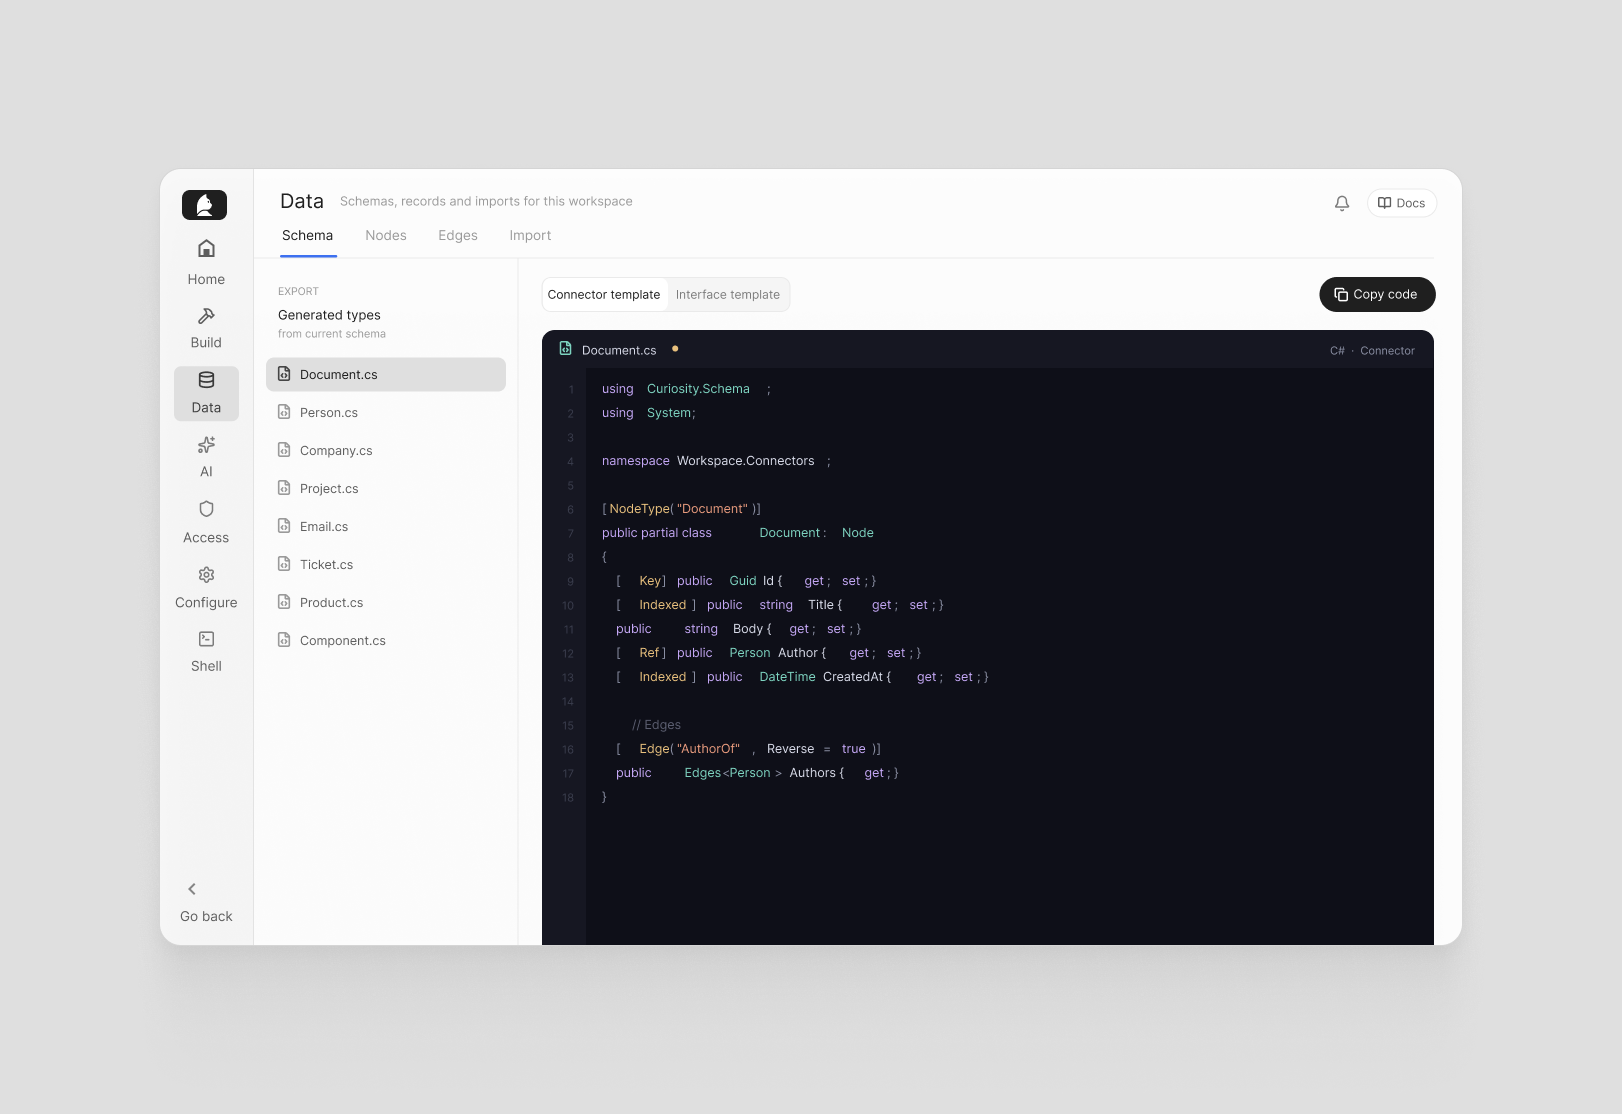
The Schema tab also exports your data model as typed C# code — separate templates for Connectors and for Interface integration. Copy, paste, and you have a strongly-typed foundation for building a new connector or wiring up a frontend, without writing boilerplate from scratch.
The full schema is also available as browsable, downloadable JSON for any tooling that needs it.
Import
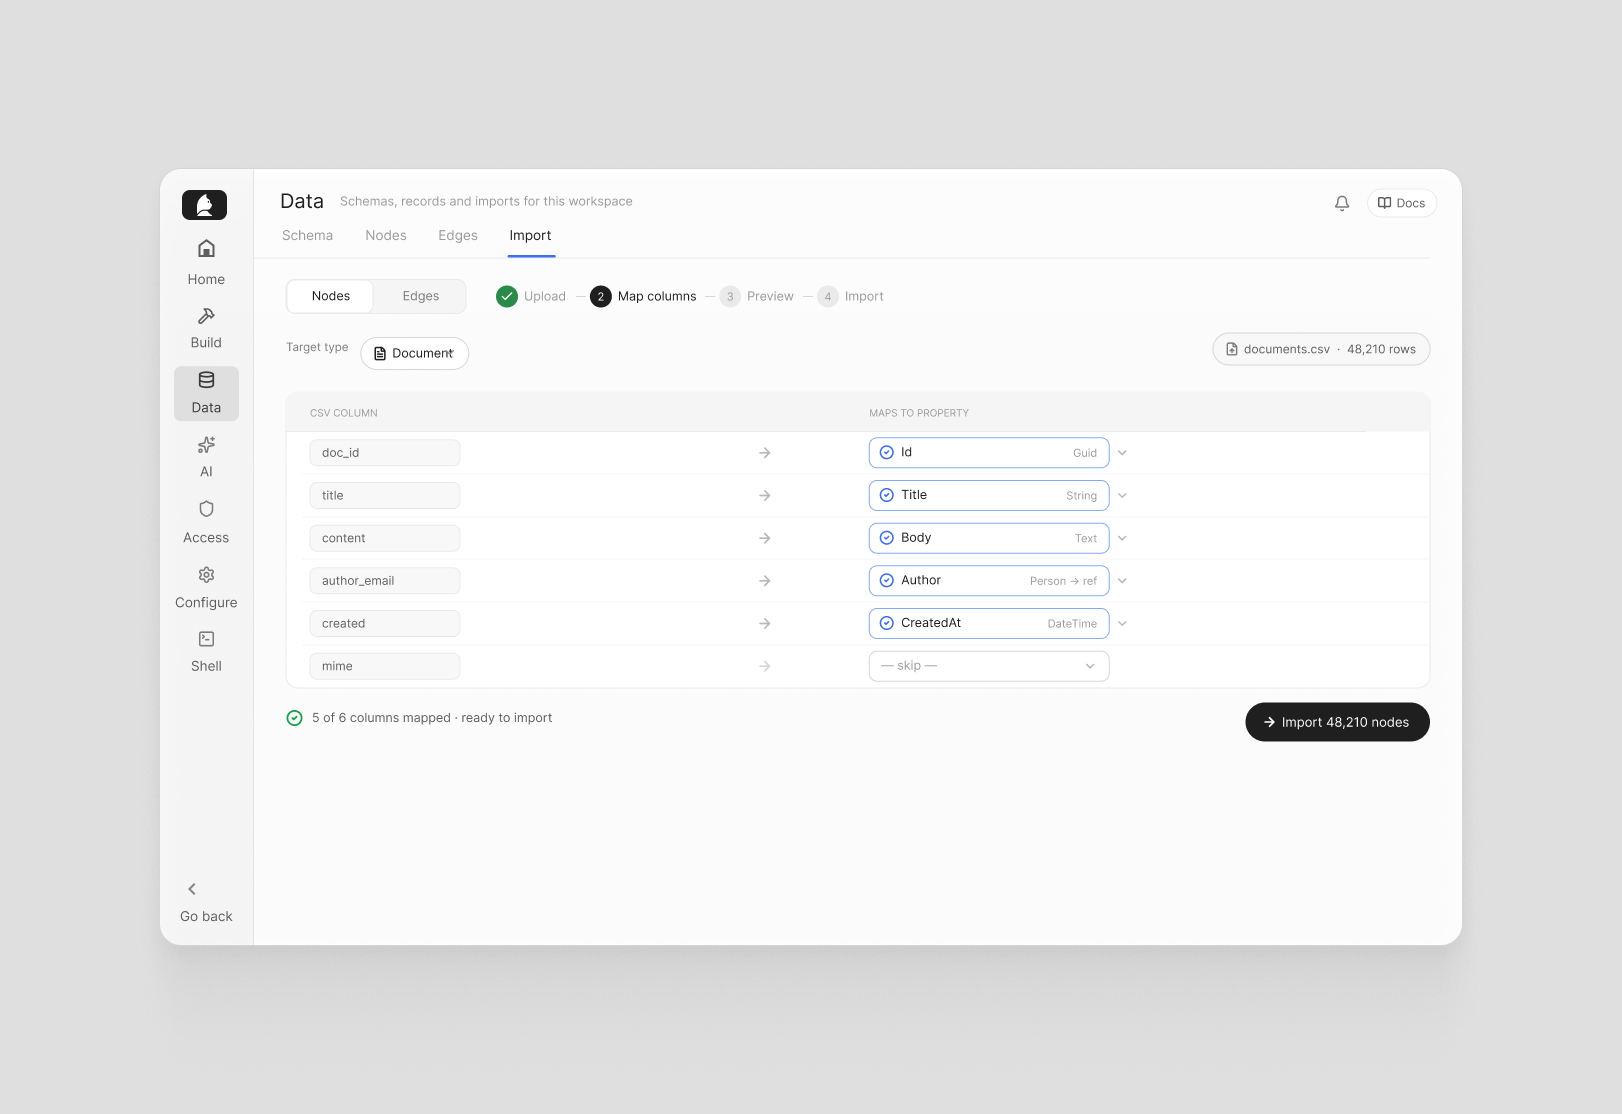
Separate CSV import flows for nodes and edges make it straightforward to bring structured data into the graph without custom tooling. For teams migrating data or bootstrapping a new deployment, it's the fastest path from a spreadsheet to a working graph.
Knowing what you have
The best knowledge graph is one people can actually navigate. These updates make it easier to understand your data model at a glance, manage it without risk, and build on top of it without starting from scratch every time.
If you're working with data in Curiosity, the developer docs are a good starting point. Or get in touch — we're happy to help.