
Curiosity for builders: a new admin experience
 The Curiosity Team
Curiosity is a platform you build on. Endpoints, AI tools, data connectors and agents are all meant to be extended and shaped to a specific use case, and more partners and customers now build directly on it. So we rebuilt the admin for the people doing that work. What changed:
Navigation built around roles
The admin now has a persistent navigation rail with eight sections: Home, Operate, Build, Data, AI, Access, Configure, Shell.
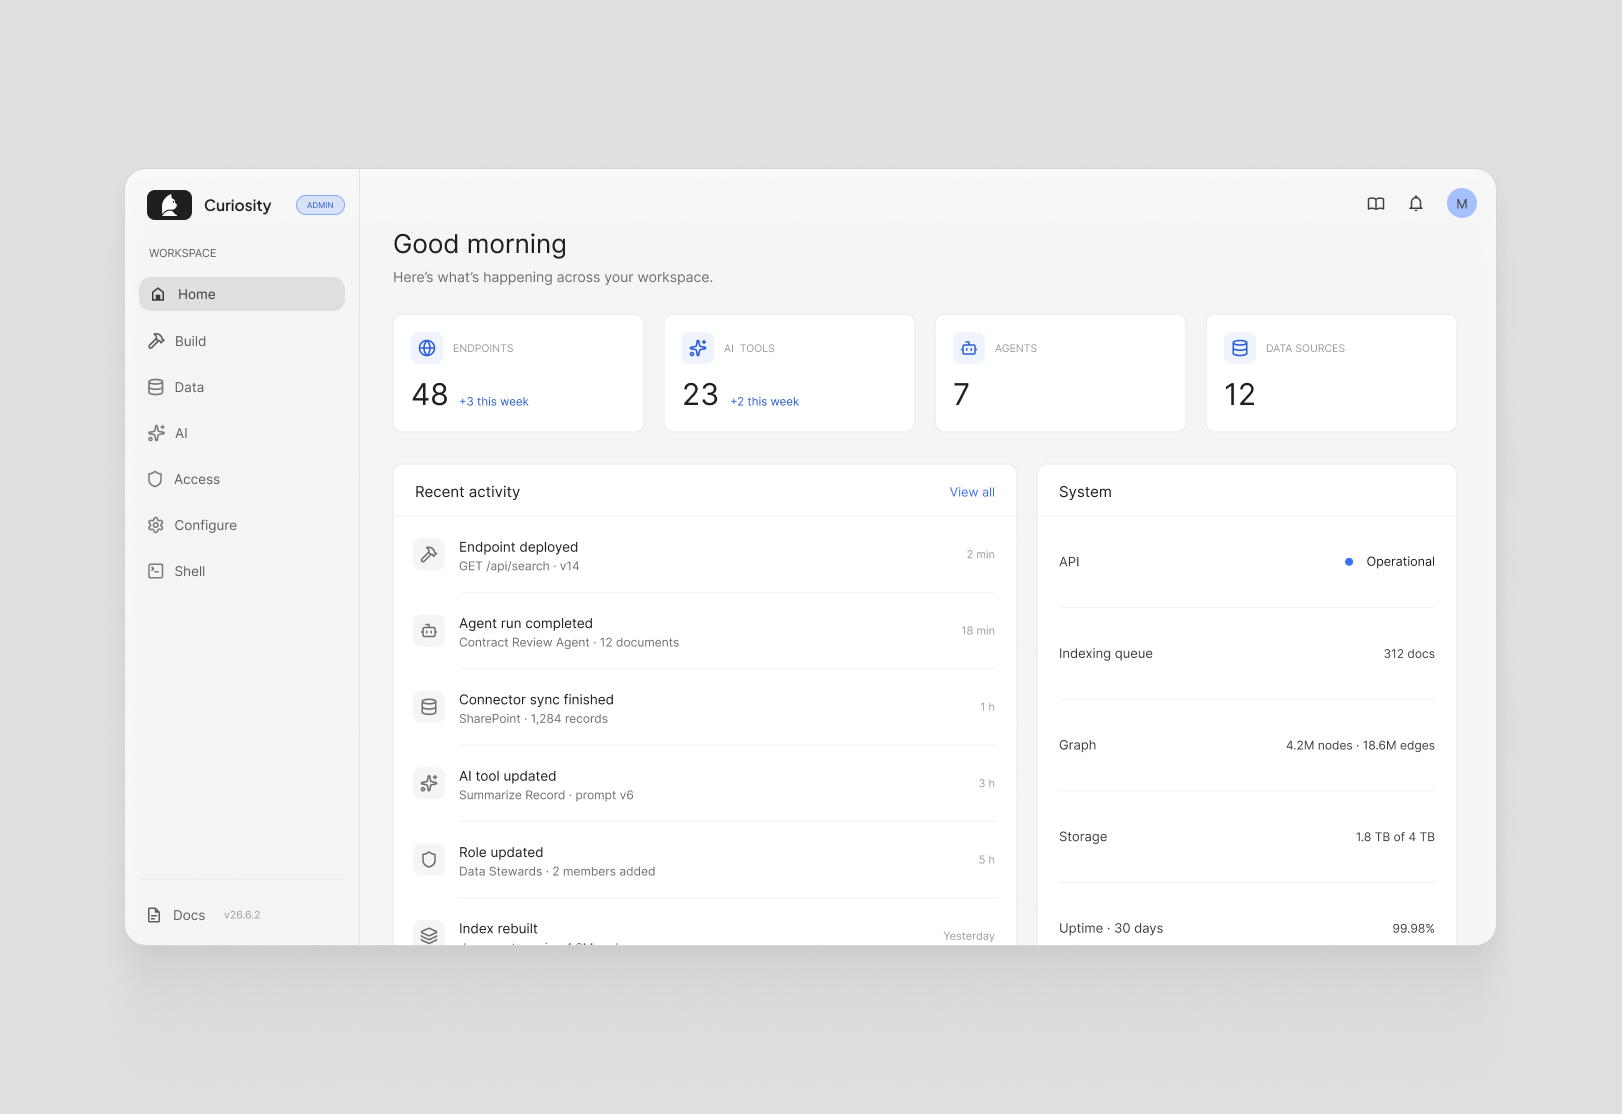
Each maps to a kind of work. Operators use Operate, developers use Build, data stewards use Data, and access control has its own section. Every section is one click from anywhere in the admin, with no sub-menus and no flat sidebar to hunt through. It also makes it easier to hand one part of the admin to the people responsible for it.
A proper IDE for building
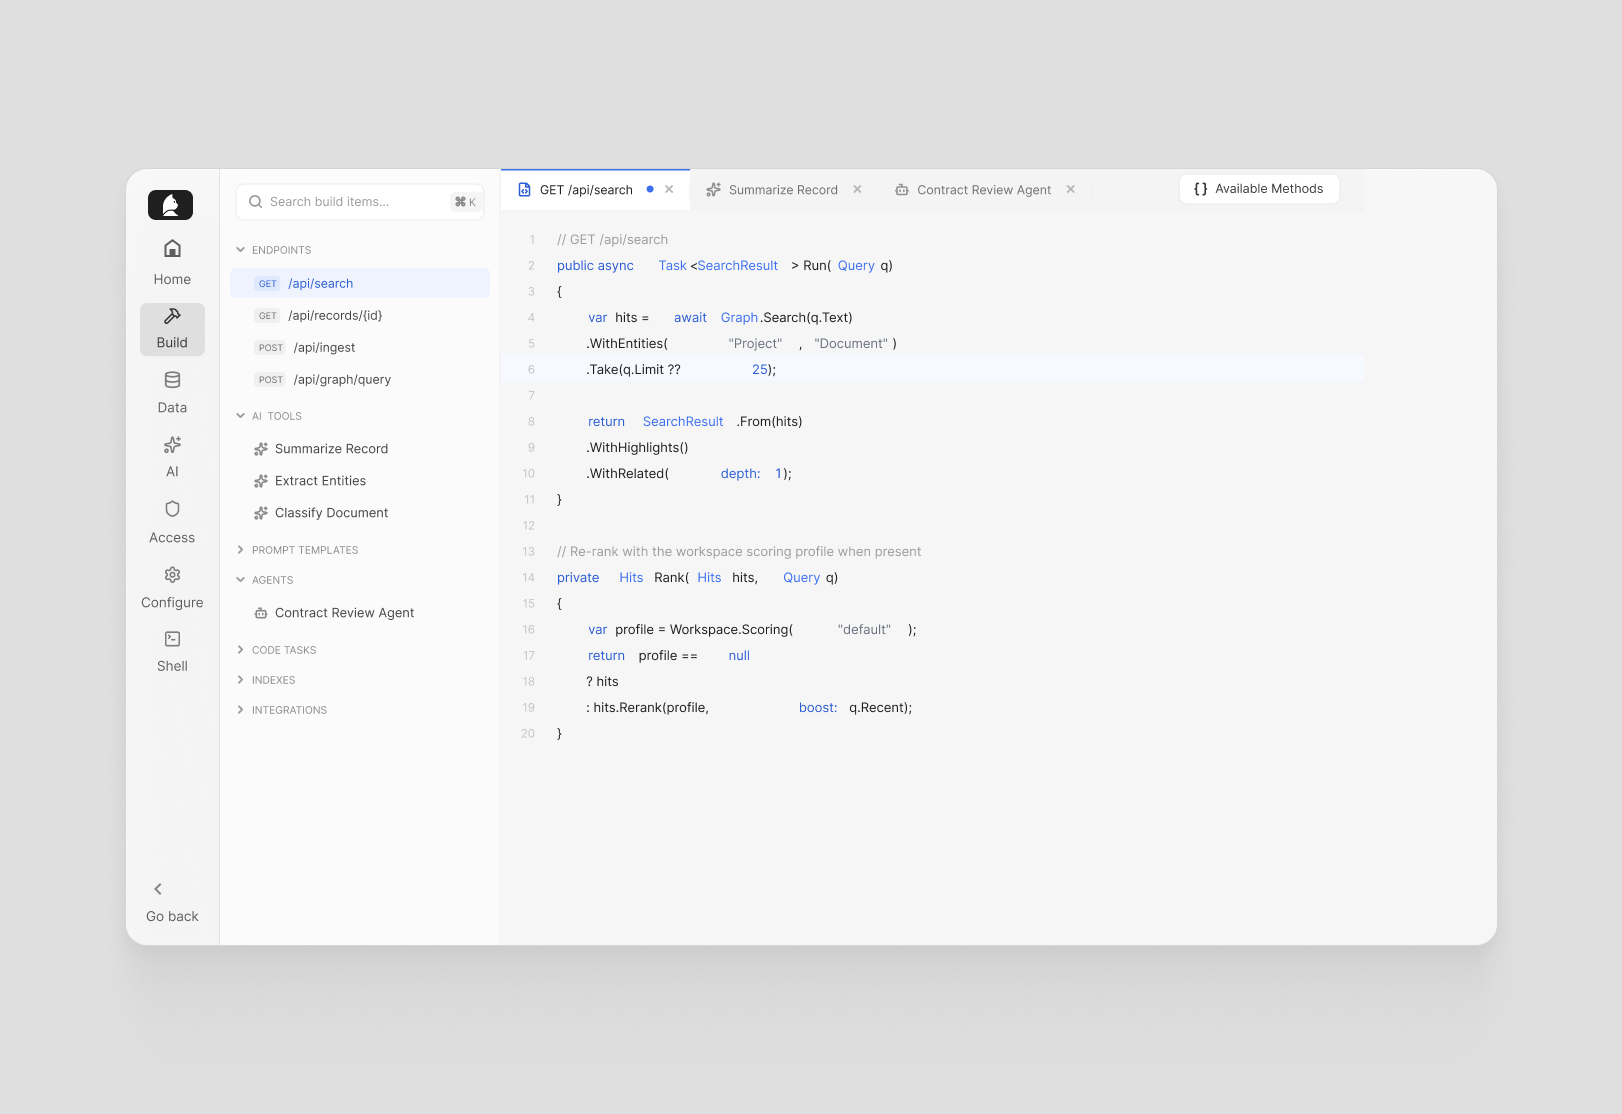
The biggest change is in Build, which is now an IDE.
Everything a developer works on (endpoints organized by URL path, AI tools, prompt templates, agents, code tasks, indexes, integrations) lives in a collapsible file tree on the left. Click anything and it opens in a tab on the right. Several tabs can be open at once, Ctrl+Tab switches between them, and each tab shows an unsaved-changes indicator.
Tab state is encoded in the URL. Reload and your tabs come back as you left them. Share the link and a colleague lands in the same view, with the same tabs.
The admin AI assistant tracks whichever tab is active. When you ask it something, it already knows what you are working on, so you do not need to paste in code.
Live search filters the whole tree across names, descriptions and code content, and a command palette reaches every item from the keyboard.
Sandbox mode in the Shell
The Shell, where admins run queries and scripts directly against the graph, now has a sandbox mode.
Switch it on and the execution scope becomes read-only on the server: no write transactions, only read-only endpoints. The Available Methods panel shows only what is callable in that scope. It is the same Shell and the same queries, with a server-enforced guarantee that nothing changes. Use it when exploring live production data, demonstrating something, or onboarding a new team member.
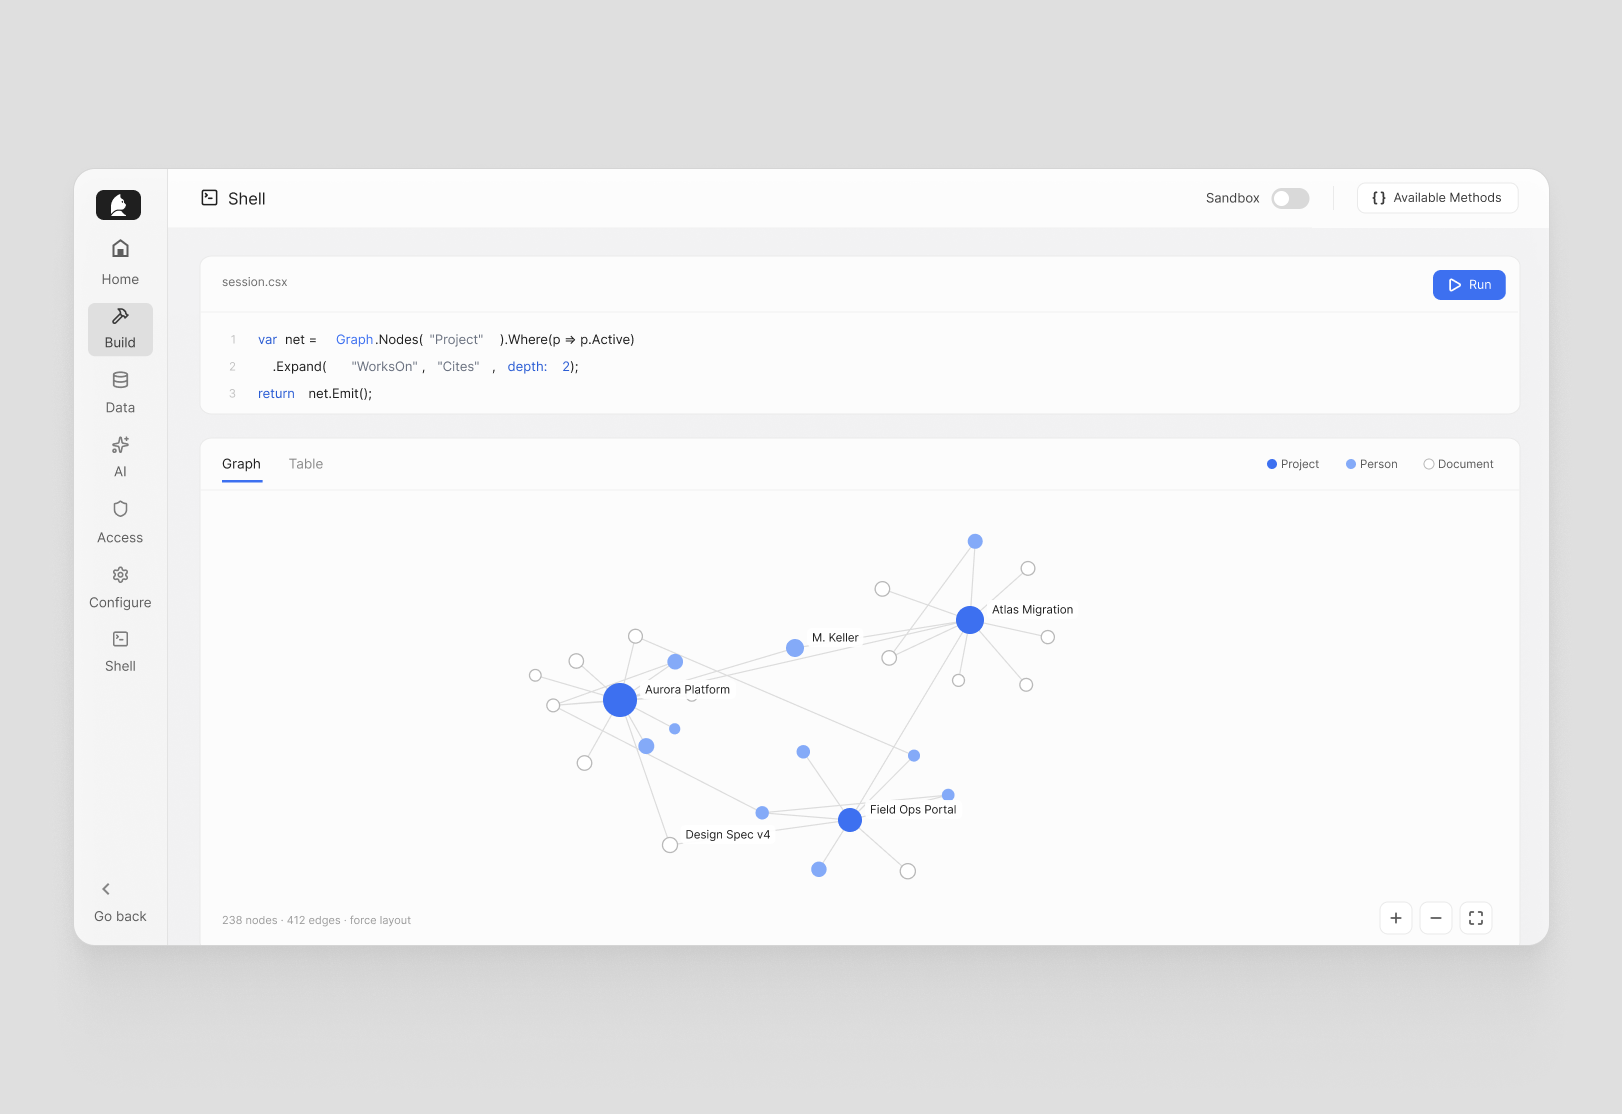
The Shell also renders query results as an interactive force graph. Write a traversal, emit nodes, and instead of rows in a table you see which nodes connect to which. It is a quicker way to validate data and spot unexpected relationships.
Available Methods, always in reach
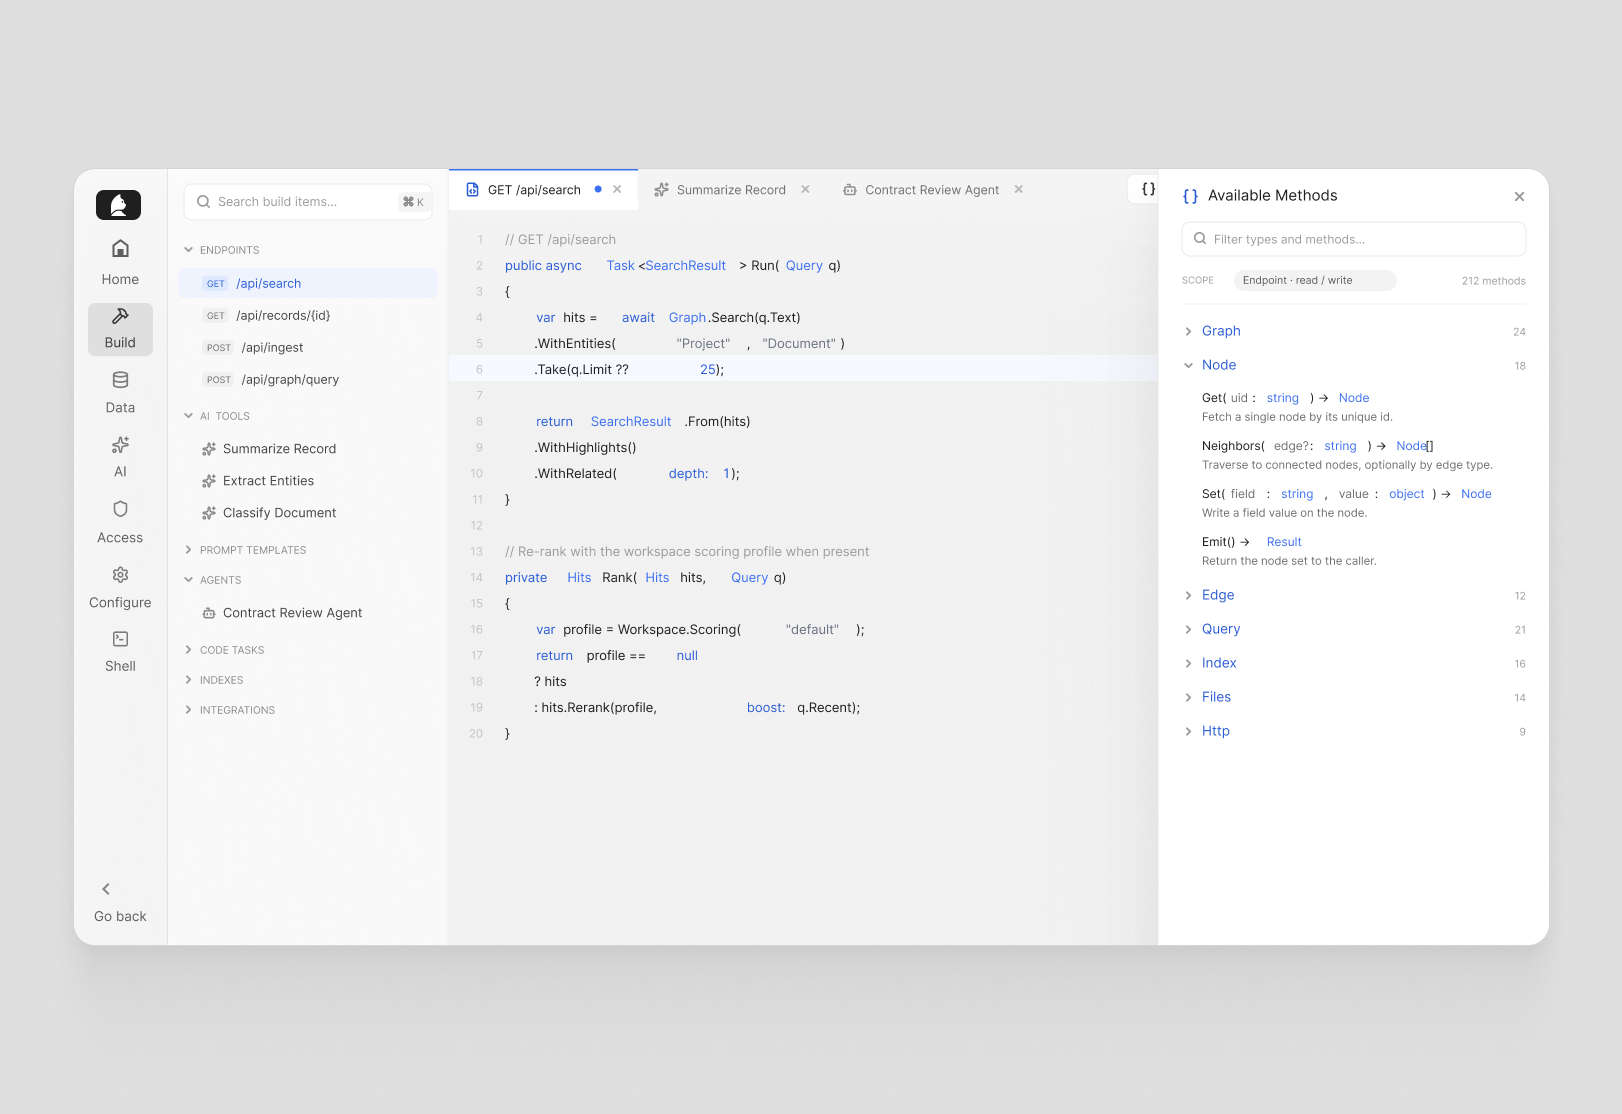
Every code editor in the admin now has an Available Methods button: in the Shell, the Build IDE, the AI tool editor, everywhere.
Click it and a panel shows the API surface available in that execution context: every type and every method, with documentation generated from the runtime, so it matches what is deployed. Type names are clickable and open their member documentation inline, without switching to external docs.
For the teams building on Curiosity
Partners, customers and internal teams build on Curiosity, and the builder experience should be as good as the platform. This is a step in that direction, with more to come.
If you are building on Curiosity, start with the developer docs, or get in touch and tell us what you are working on.
Read next
Articles on context graphs, enterprise search and industrial AI